My reach dropped 23%, but engagement went up 10% in 90 days. Here's why I'm not worried.
What 587,967 impressions taught me about the new LinkedIn algorithm
I just looked at my last 90 days of LinkedIn analytics next to Saywhat's Q1 2026 algorithm report that was presented on May 6th, and something suddenly made sense.
Reach is collapsing across the platform. Median impressions on LinkedIn are down 68% from their 2023 peak, according to the report and according to EVERYONE ON LINKEDIN.
And yet, the people writing the best content for the right audiences are doing better than ever. Both things are true at the same time.
Here is what my numbers look like:
587,967 impressions, down 23.1% versus the prior 90 days
13,569 engagements, UP 10.2%
4,904 comments, 2,013 saves, 6,045 reactions, 298 sends, 59 reposts
Engagement rate went UP from about 1.6% to 2.3%
Fewer people saw my posts. The ones who did, engaged more. That sounds like a worse 90 days. But it's not, it's an improvement!
The chart that made it clear
When I switched from cumulative to daily impressions, I saw what a lot of you would also see if you looked: a flat baseline of 3,000 to 7,000 impressions a day, punctuated by a number of big spikes.
The algorithm report says: for average creators, the bottom 80% of posts get 11% of the impressions. Growth comes from understanding why your spikes happen and building from there.
So I went and looked at my spikes, my top performing post.
My top-impression posts are not my best posts
This is where it gets interesting, and where I think most LinkedIn analytics conversations go wrong.
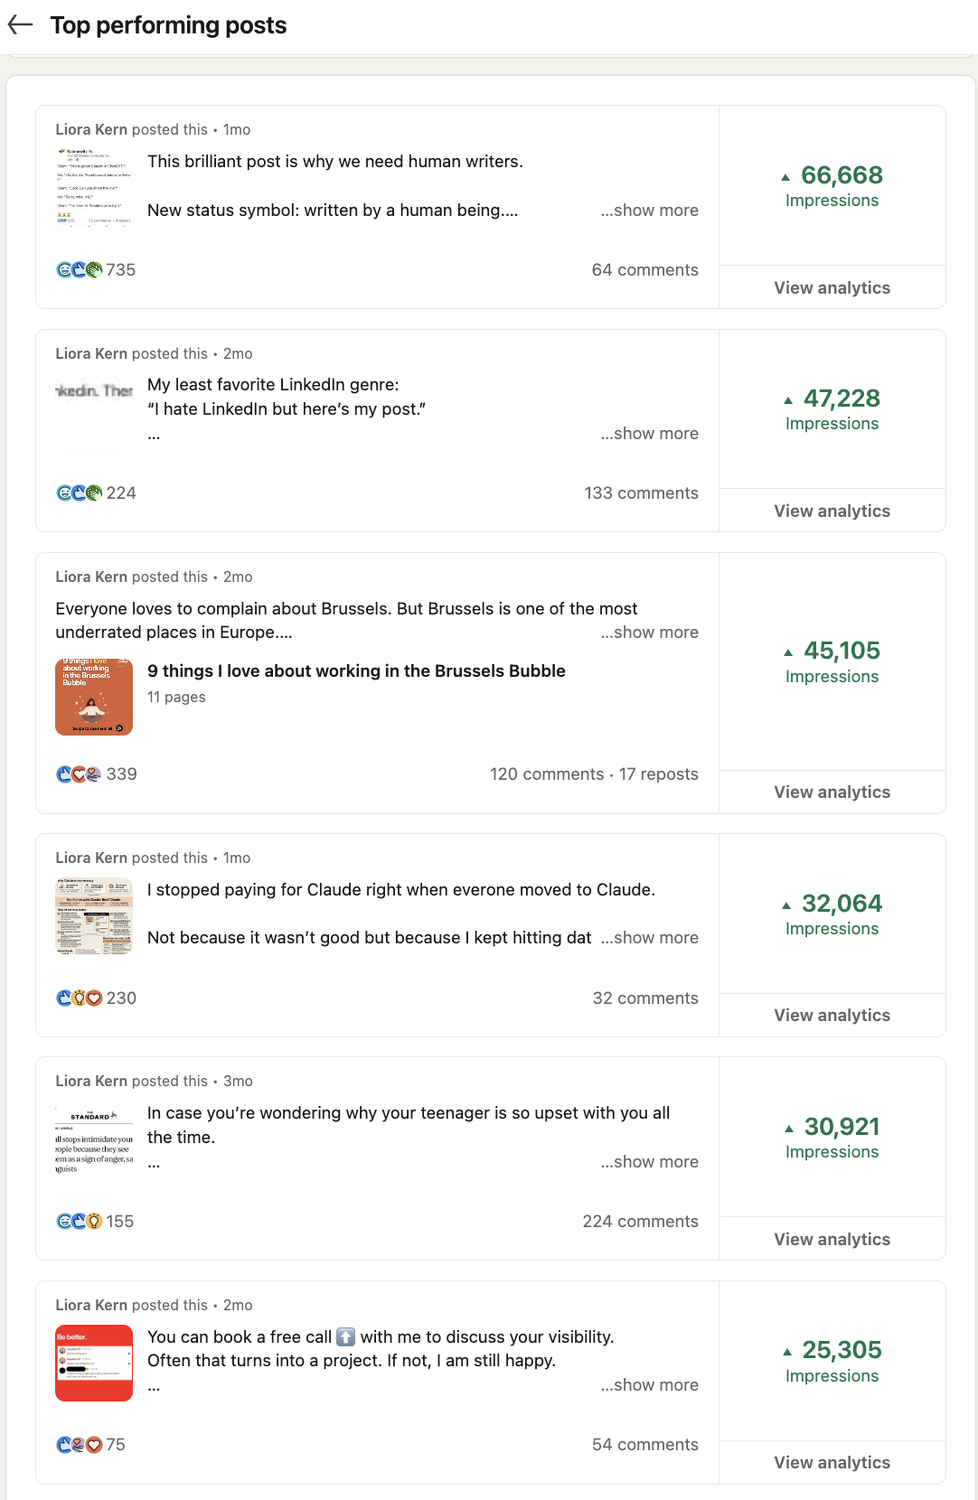
My top six posts by impressions over the last 90 days were:
1. A fun post about why we need human writers. 66,668 impressions, 735 reactions, 64 comments
2. A rant about the "I hate LinkedIn but here's my post" genre. 47,228 impressions, 224 reactions, 133 comments
3. "9 things I love about working in the Brussels Bubble" carousel. 45,103 impressions, 339 reactions, 120 comments, 17 reposts
4. An infographic about how to use Claude so you don't use up your data within 5 minutes. 32,057 impressions, 230 reactions, 32 comments and 841 saves!
5. A post about teenagers finding our punctuacion aggressive. 30,914 impressions, 155 reactions, 224 comments
6. A post complaining about people not showing up when they book calls with me. 25,299 impressions, 75 reactions, 54 comments.
Top performing post during the last 90 days in terms of impressions
Now look at the post that had the biggest impact on my actual business.
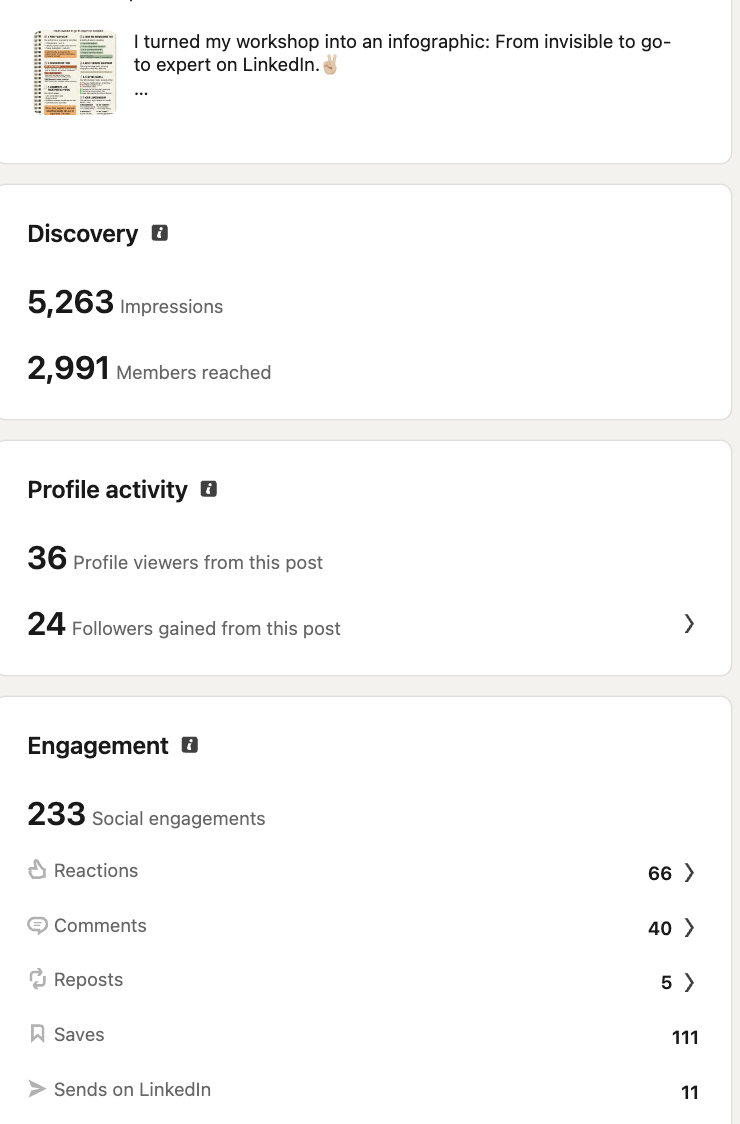
It was a post about a workshop I gave with an infographic "From invisible to go-to expert on LinkedIn." Saved 111 times, reposted 5 times, 24 new followers. And much more importantly: 5 people reached out to me as a result of this post. I got two new workshops as a result, and a potential DNA project. Out of one post!
But it only got 5,261 impressions. The mismatch tells you so much.
One of my posts with the most impact recently
Three different posts with three different roles
Once I saw this, I stopped looking at LinkedIn metrics as one big number and started seeing three different scoreboards:
Impressions reward broad-appeal posts.The light posts. The opinionated posts. The fun posys. The "human writers" post and the Brussels post hit relatable nerves. They reached far. They also brought in a lot of casual scrollers who liked, scrolled, and forgot.
Saves reward reference value. My Claude infographic and my workshop infographic do not go viral. They get filed away. People come back to them. Saves are the closest thing LinkedIn has to a bookmark, and the new LLM-ranked feed reportedly weights them heavily because they signal "this is a tool I will use again."
Followers reward identity and point of view. The posts that grew my audience were not the ones with the most reactions. They were the ones where my methodology, my voice, and my position came through clearly. Audiences follow creators. The report puts it that way, and my data agrees.
These three modes need different posts. A post optimized for reach is rarely the post that earns a save. A post optimized for saves is rarely the post that goes viral.
What changed in the algorithm
In March, LinkedIn engineering published a piece explaining their new feed: an LLM-powered ranking system that tries to understand what content actually means and how relevant it is to each member's current goals, not just who they are connected to.
What this does in practice:
It pushes content toward the right audience (more or less anyway)
It rewards dwell time, comments, and saves over passive reactions
It shrinks the second-degree spillover that used to drive viral reach
It widens the gap between top creators and average creators because relevance compounds
If you measure yourself only by impressions, this new feed looks like a punishment.
If you measure yourself by saves, comments, follower quality, and DMs, it looks like an upgrade.
What I am doing differently now
A few things I am changing based on this analysis:
I am studying my saves. The infographic that got 841 saves is the one I want to reverse-engineer. What made it save-worthy? A clear methodology someone could apply tomorrow. That is a repeatable formula for me.
I am separating my content goals before I write. Before I post, especially for my clients, I now ask: is this for reach, for saves, or for follower growth? That answer changes the hook, the format, and the call to action.
I am tracking reposts more seriously. Out of 13,569 engagements, only 59 were reposts. Reposts are the single best way to escape your first-degree network in the new algorithm. That is a weak spot for me, and probably for most of you reading this.
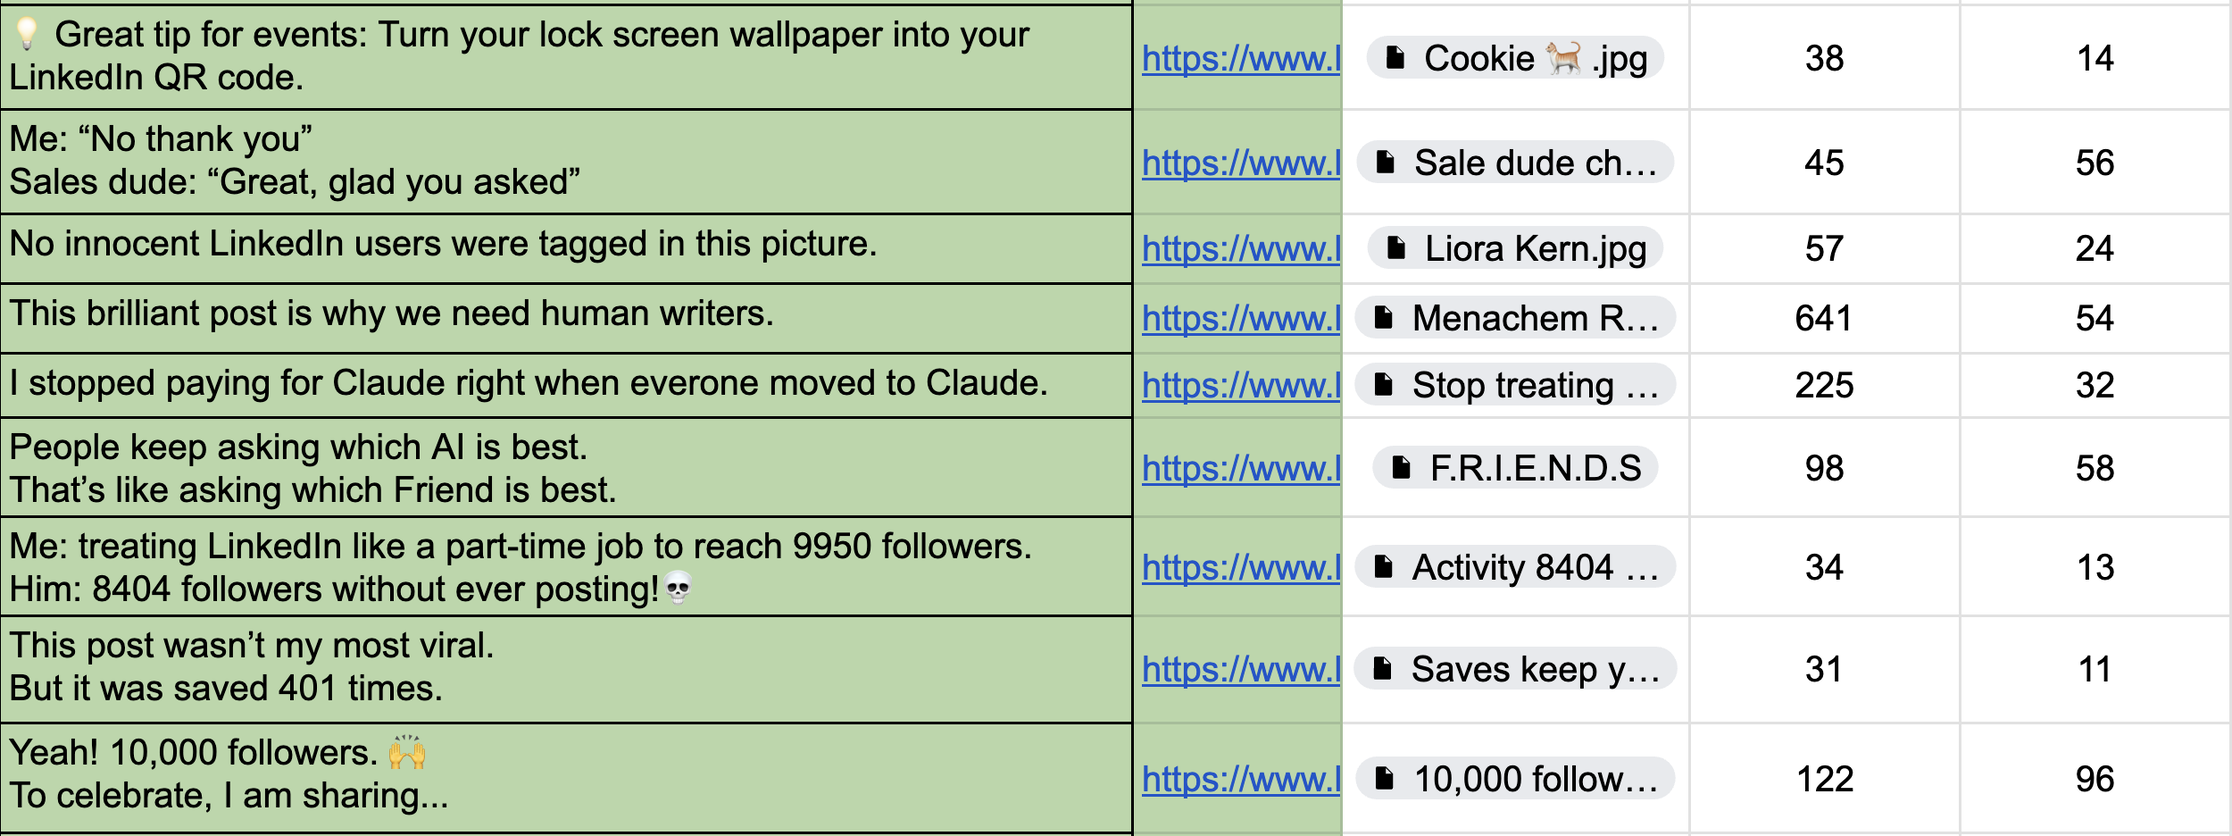
I am protecting my baseline. A flat baseline with occasional spikes is fine. A flat baseline with no top performers is a problem. The Saywhat report's advice to study your top 20% of posts and stop expecting the bottom 80% to magically improve is exactly right. Don't look at individual post impressions - keep an eye out for patterns, and put your posts and the important data (saves, sends, reposts, comments, followers) in a spreadsheet if you're serious about making LinkedIn work.
Part of my LinkedIn spreadsheet in which I keep all my data per post
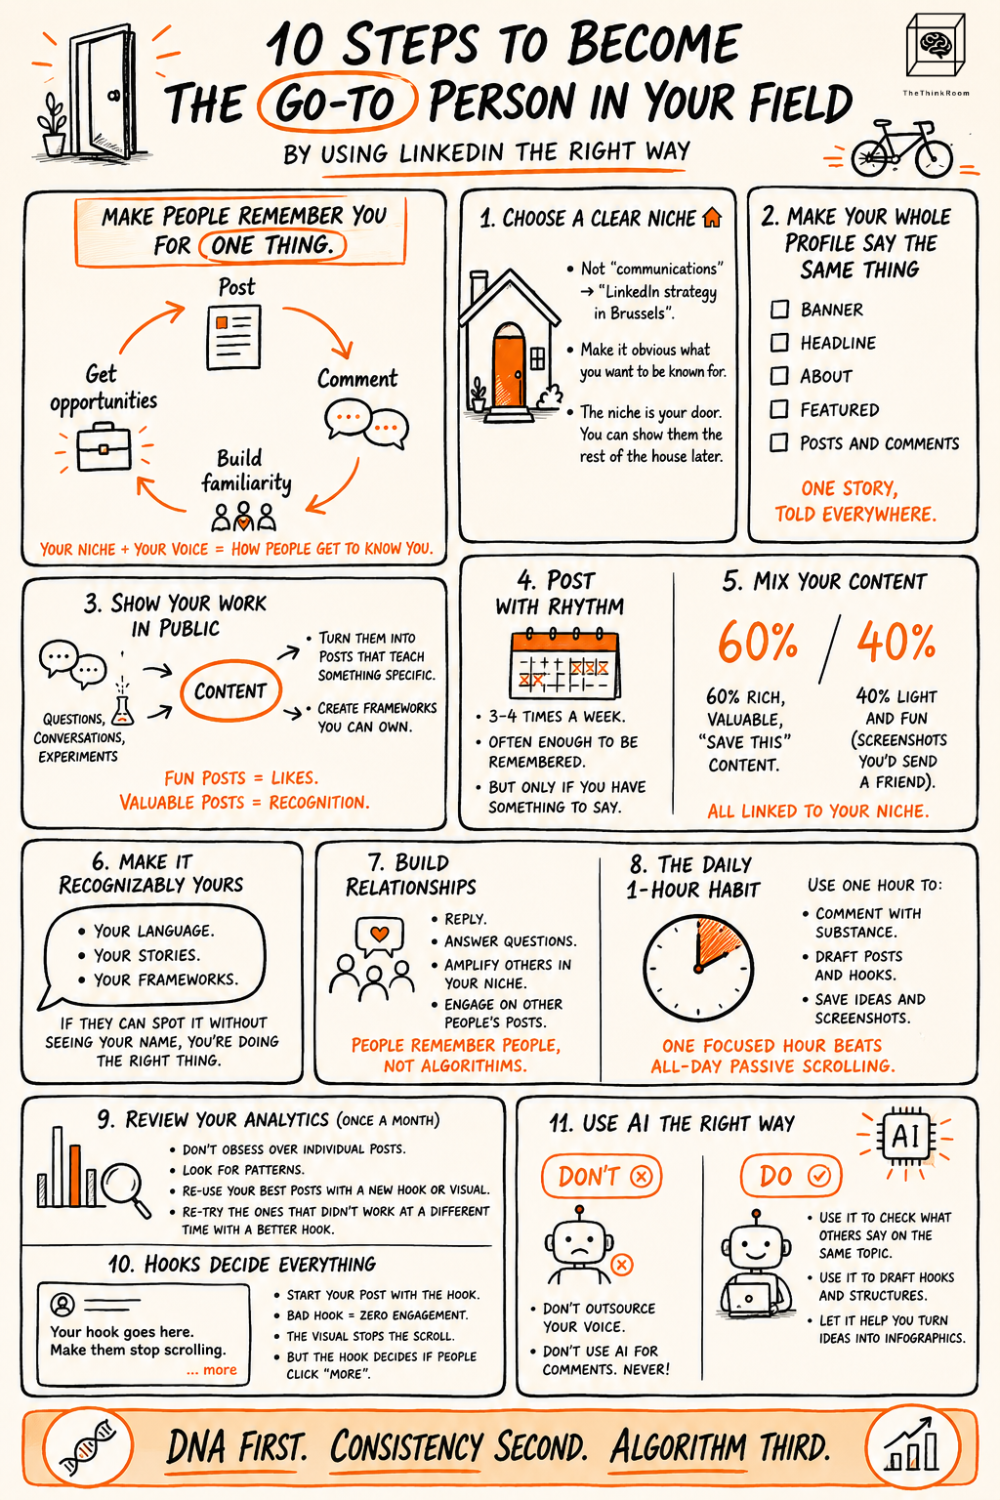
I am posting more infographics and frameworks. The data is clear. My workshop infographic and my Claude infographic outperformed almost everything else on the metrics that matter to my business.
Example of one of my infographics
How to reframe it to feel better
If your impressions are down and your engagement rate is up, you are probably doing the right thing for 2026, even if it does not feel like it.
If your top-impression posts and your top-save posts are different posts, that is information. It tells you which posts to chase reach with and which ones to build your business with.
The question is what game are you trying to win?
Mine is saves and follower quality. That means I will keep writing posts that travel further than I expect, but I will spend more of my time building the resources my audience saves and shares privately.
Yours might be different. Pick one on purpose.
Hi! I am Liora Kern. With The Think Room we find your unique DNA, write your DNA Key so you stand out in a tsunami of sameness.
Sources:
- Chris Donnelly's Saywhat & The Creator Accelerator, State of the Algorithm Q1 2026
- LinkedIn Engineering, "Engineering the next generation of LinkedIn's Feed," March 2026
- My own LinkedIn analytics, Feb 6 to May 6, 2026